Image
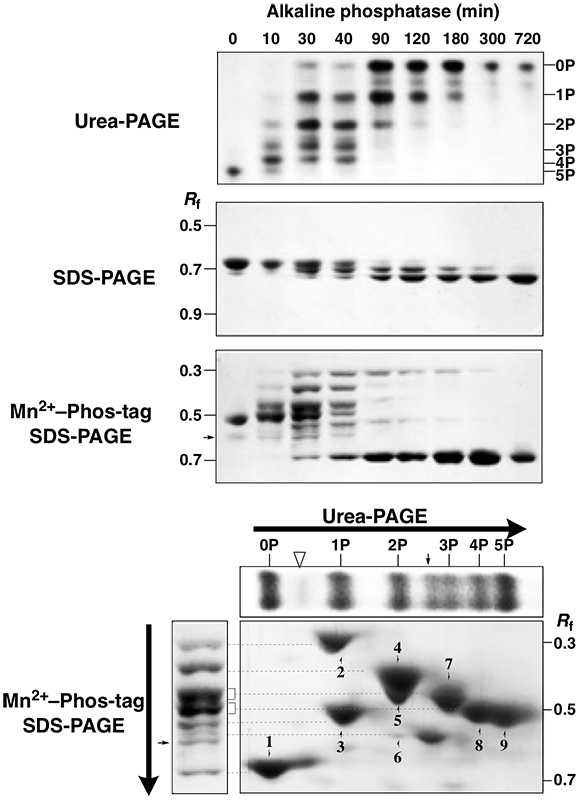
A pentaphosphorylated β-casein was analyzed.The phosphatase assay (AP for 0–720 min)were analyzed by urea-PAGE, normal SDS-PAGE, and Mn2+–Phostag SDS-PAGE .
The urea-PAGE showed that the time-course reaction of βcasein were separated as six bands with different phosphate stoichiometries and the pentaphosphoprotein was fully dephosphorylated for 720 min.
In normal SDS-PAGE, the protein isotypes were observed at an Rf value of ca. 0.7. In contrast to
In Mn2+–Phos-tag SDS-PAGE, multiple bands were observed. The number of bands detected was more than six by the urea-PAGE. After the AP treatment for 30 min, seven clear bands appeared in the Rf range of 0.3–0.7 except for a faint band (arrow at an Rf value of 0.6), which is a
contaminant in the commercially available β-casein. Interestingly, some bands showing a smaller migration than that of the complete phosphorylation form of β-casein were detected in the reaction time of 10–300 min, and the slowest band (Rf 0.3) was still observed at the reaction time of 300 min. This suggests that the migration degree of the protein phosphoisotypes in Mn2+–Phos-tag SDS-PAGE might be due to not only phosphate stoichiometry but also other factors, such as the phosphorylation sites.
To examine the relationship between the phosphate stoichiometry and migration distance of the protein phosphoisotypes in Mn2+–Phos-tag SDS-PAGE, we performed 2-DE coupling urea-PAGE as the first dimension and Mn2+–Phos-tag SDS-PAGE as the second dimension, using a mixed sample of the complete phosphorylation, complete dephosphorylation, and partial dephosphorylation forms of β-casein. The 2-D strategy easily allowed us to assign the correspondence between six bands in urea- PAGE (reclined upper panel) and seven bands in Mn2+–Phos-tag SDS-PAGE (left panel). Single bands of 0P, 3P , 4P , and 5P on the first dimensional gel were migrated as single spots of 1, 7, 8, and 9, respectively, on the second-dimensional gel. On the other hand, single bands of 1P and 2P were separated as multiple spots of 2–3 and 4–6, respectively. Similarly, the 2-D procedure enabled the third and fourth bands from the top of the 1-D Mn2+–Phos-tag SDS-PAGE gel (see left panel) to separate as double migration spots of 5 (2P) and 7(3P) and 8 (4P)
and 9 (5P), respectively. These results show that the separation of the protein phosphoisotypes was better by coupling urea-PAGE and Mn2+–Phos-tag SDSPAGE than by each 1-D procedure separately. The same faint band observed in 1-D Mn2+–Phos-tag SDS-PAGE (arrow in the left panel) was observed on the seconddimensional gel and the 1-D urea-PAGE gel (reclined upper
panel) between the 2P and 3P isotypes (arrows). Another faint band was observed on the 1-D urea-PAGE gel (open triangle in reclined upper panel) as well as on the second dimensional
gel between the 0P and 1P isotypes (opentriangle).
Related data
β-casein (Mn2+-Phos-tag)
β-casein(2D;IEF/Mn2+-Phos-tag SDS-PAGE)
.png)
